
While Sentdex has long provided sentiment analysis in the form of historical sentiment moving averages, many people have complained that reading these charts can be challenging at times. Many of the charts are very "noisy," and understanding how to read them can be confusing.
The Sentdex charts used to be a subscription-service, though I have since moved them to free, with the goal of eventually creating sentiment signals that could be used directly for trading. Those are finally done, and can be accessed via a paid subscription to the Sentdex API, or via the Sentdex Sentiment Signals Sample.
The idea behind the sentiment signals is to provide signals that can be used as a stand-alone parameter for trading, or to incorporate them into a more complex strategy. This has now been done, and here are some of the findings!
First, we need to cover what the sentiment analysis signals are. The signals currently vary from -3 to a positive 6, where -3 is as equally strongly negative of sentiment as a 6 is strongly positive sentiment.
Sentiment signals:
Anyone can access, for free, the stock sentiment analysis trading signals sample file, which contains historical, daily, trading signals: Sentdex Sentiment Signals Sample
Via the paid-API, there are many forms of granularity, but the sample is 1 day means, taken 30 minutes prior to market open, in GMT time, which is 1300 GMT. Any stock that has a signal reported for that day has had some sentiment within the last 24 hours. Many companies may not be included, if they haven't had a sentiment report in the last 24 hours.
Example sliced output:
date,symbol,sentiment_signal
2014-12-26 13:00:00,INTC,4
2014-12-26 13:00:00,TRIP,0
2014-12-26 13:00:00,JCP,0
2014-12-26 13:00:00,VIAB,1
2014-12-26 13:00:00,SD,0
2014-12-26 13:00:00,DPS,-3
2014-12-26 13:00:00,SHLD,-3
2014-12-26 13:00:00,GMCR,0
2014-12-26 13:00:00,ARO,0
2014-12-26 13:00:00,CBG,0
With these samples, we can begin to write trading strategies to back test. For this, I have used a third-party back-testing service, Quantopian.
First, we can build a very basic strategy that simply buys when sentiment is superb, holds, and sells once sentiment gets into the negatives.
To mimic this, I wrote a simple strategy, which did just this. If the stock sentiment analysis signal was a 6, the strongest possible positive, then a buy was initiated, using 10% of the portfolio's available cash, and a stop-loss of 0.5% is set. This means that we could be invested in up to 10 companies at any one time. We could try to make the strategy a bit smarter by dynamically adjusting investment size according to available investments, but we'll keep it basic for now.
After buying, the strategy holds the company until sentiment hits -1 or lower, and then a sell is initiated.
Due to restrictions with Quantopian regarding how many simultaneous companies that we can back test at any one time, we focus on getting signals from the top-200 sentiment volume companies, or the companies that have the most sentiment coming in.
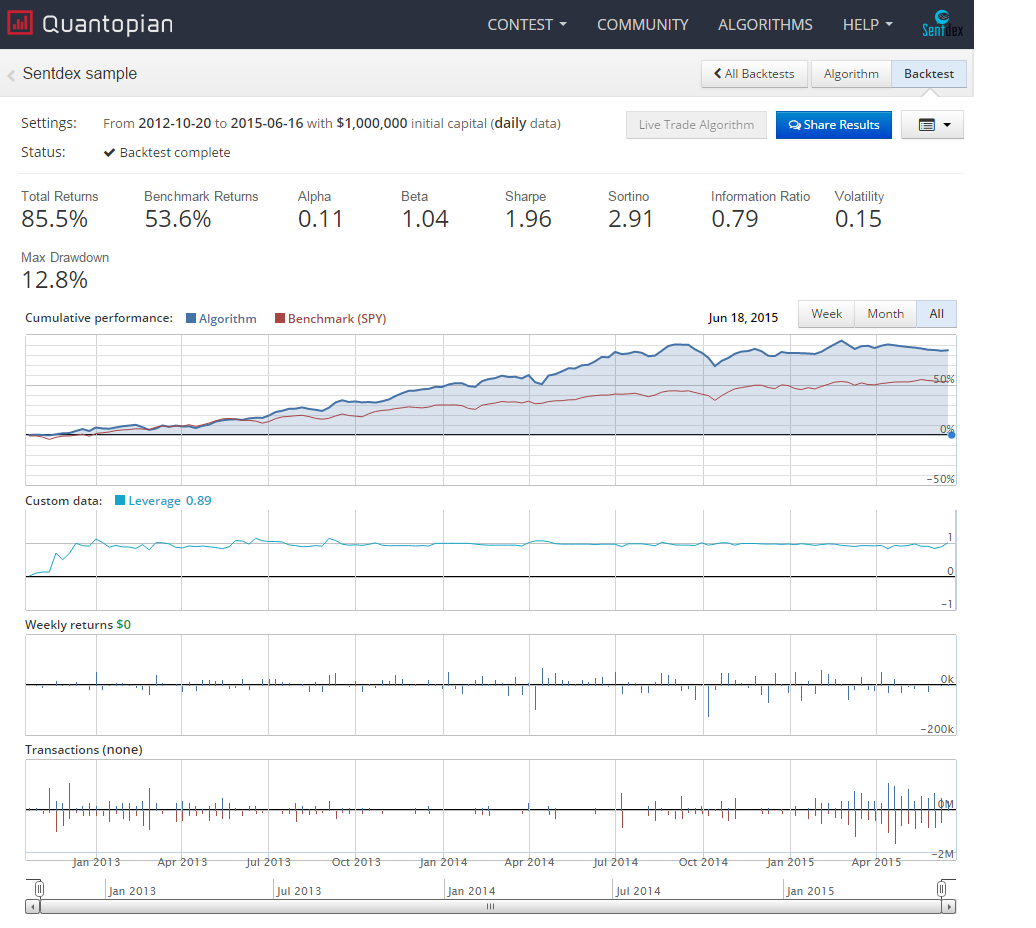
Using this simple logic, and testing against all of the history available with Sentdex, the results are quite nice:
Do you have a Quantopian account, know how to use zipline, or Python? .
(This is zipline code, so these are methods of the TradingAlgorithm class):
def preview(df):
    log.info(df.head())
    return df

def initialize(context):
    context.investment_size = (context.portfolio.cash / 10.0)
    context.stop_loss_pct = 0.995
    set_symbol_lookup_date('2012-10-01')
    fetch_csv('http://sentdex.com/api/finance/sentiment-signals/sample/', pre_func = preview)
    context.stocks = symbols('AAPL', 'MCD', 'FB', 'GME', 'INTC', 'SBUX', 'T', 'MGM', 'SHLD', 'NKE', 'NFLX', 'PFE', 'GS', 'TGT', 'NOK', 'SNE', 'TXN', 'JNJ', 'KO', 'VZ', 'XOM', 'WMT', 'MCO', 'TWTR', 'URBN', 'MCP', 'MSFT', 'HD', 'KSS', 'AMZN', 'S', 'BA', 'F', 'JPM', 'QCOM', 'TSLA', 'YHOO', 'BBRY', 'GM', 'IBM', 'C', 'ZNGA', 'BAC', 'DIS', 'SCHW', 'UA', 'CSCO', 'ORCL', 'SYMC', 'WFC', 'TM', 'EBAY', 'SCHL', 'MS', 'NDAQ', 'TIF', 'AIG', 'DAL', 'JCP', 'MRK', 'CA', 'SIRI', 'AMD', 'CVX', 'FSLR', 'LMT', 'P', 'CBS', 'TWX', 'PEP', 'LNKD', 'CMG', 'NVDA', 'BBY', 'TWC', 'M', 'RHT', 'ACN', 'CRM', 'PETS', 'CELG', 'BLK', 'GD', 'DOW', 'YUM', 'GE', 'MA', 'DTV', 'DDD', 'CAT', 'FDX', 'GRPN', 'ACE', 'BK', 'GILD', 'V', 'DUK', 'FFIV', 'WFM', 'CVS', 'UNH', 'LUV', 'CBG', 'AFL', 'CHK', 'BRCM', 'HPQ', 'LULU', 'ATVI', 'RTN', 'EMC', 'NOC', 'MAR', 'X', 'BMY', 'LOW', 'COST', 'HON', 'SPLS', 'BKS', 'AA', 'AXP', 'AMGN', 'GPS', 'MDT', 'LLY', 'CME', 'MON', 'WWWW', 'MU', 'DG', 'TRIP', 'HAL', 'COH', 'WYNN', 'PCLN', 'HTZ', 'CLF', 'DD', 'ACI', 'FCX', 'AON', 'GMCR', 'CSX', 'ADBE', 'PRU', 'PG', 'MYL', 'STT', 'PPG', 'EXPE', 'KORS', 'JNPR', 'UTX', 'HOT', 'SNDK', 'CCL', 'DRI', 'BIIB', 'MHFI', 'BBT', 'APA', 'A', 'TDC', 'ANF', 'MTB', 'PPL', 'ABT', 'GNW', 'KMI', 'MET', 'FE', 'DVA', 'ETFC', 'GLW', 'NRG', 'INTU', 'KR', 'ARNA', 'VALE', 'MSI', 'EOG', 'AET', 'MAT', 'HST', 'COP', 'MO', 'IVZ', 'HUM', 'NUE', 'CI')

# Will be called on every trade event for the securities you specify.
def handle_data(context, data):


    cash = context.portfolio.cash
    try:
        for s in data:

            if 'sentiment_signal' in data[s]:
                sentiment = data[s]['sentiment_signal']
                current_position = context.portfolio.positions[s].amount
                current_price = data[s].price

                if (sentiment > 5) and (current_position == 0):
                    if cash > context.investment_size:
                        order_value(s, context.investment_size, style=StopOrder(current_price * context.stop_loss_pct))
                        cash -= context.investment_size


                elif (sentiment <= -1) and (current_position > 0):
                    order_target(s,0)

    except Exception as e:
        print(str(e))